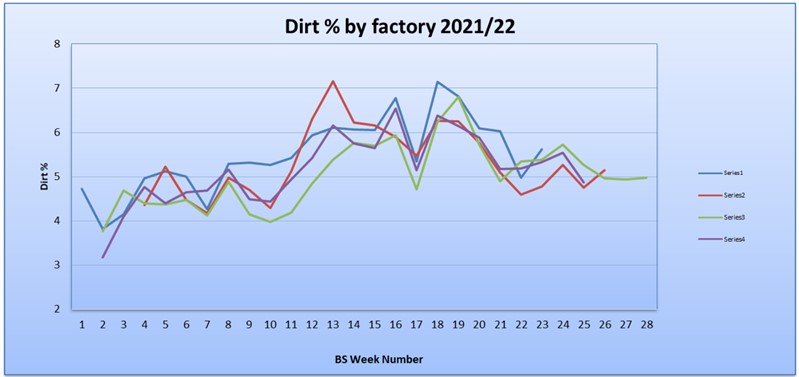
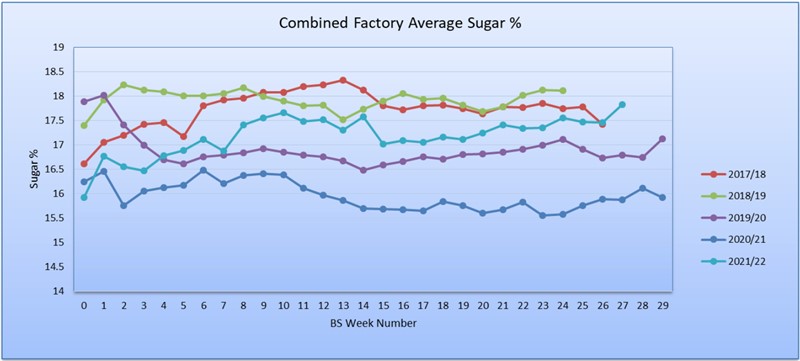
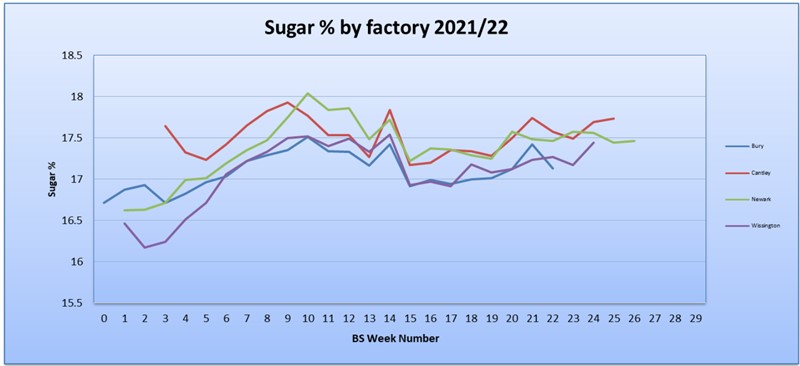
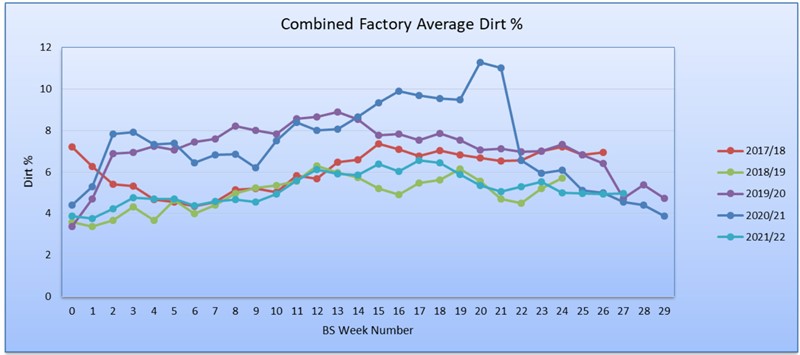
The x-axis scale shown on all graphs is one of week number to identify comparable information from year to year – note each campaign can start on a different week of the year.
The data will updated on a regular basis throughout the campaign.
First published31 March 2022
All data is sourced from British Sugar.
The x-axis scale shown on all graphs is one of week number to identify comparable information from year to year – note each campaign can start on a different week of the year.
The data will updated on a regular basis throughout the campaign.
Once you have submitted your query someone from NFU CallFirst will contact you. If needed, your query will then be passed to the appropriate NFU policy team.