This year, Back British Farming Day gave us an opportunity to remind MPs why they must have British food and farming at the forefront of their strategy to win votes in the upcoming general election.
The Farmer Favourability Survey polled 2,000 people in England and Wales and farmers came out ahead of teachers, engineers, police officers and lawyers in people’s perceptions, coming second only to nursing.
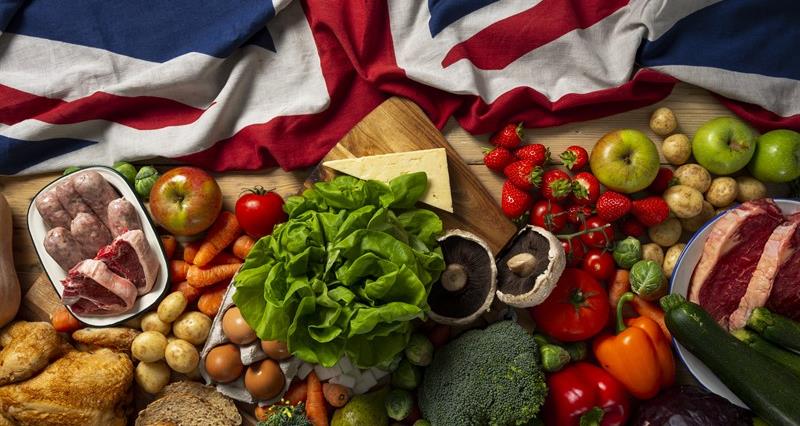
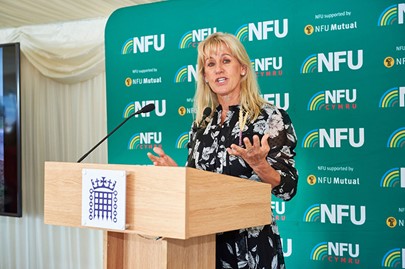
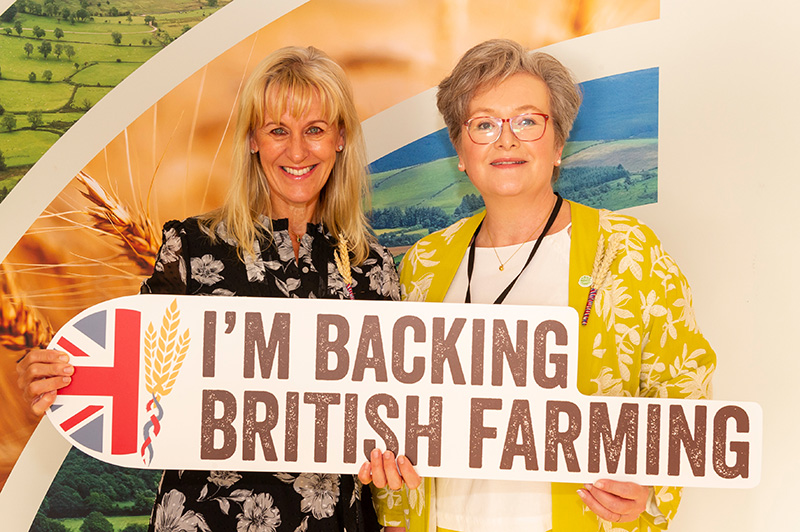
NFU President Minette Batters said: “Britain’s farmers and growers are truly inspirational, and it is heart-warming to know the public really value the work we do in producing fantastic homegrown food. This food underpins the British food and farming sector and is worth more than £100 billion to the national economy, all while protecting and enhancing our iconic landscapes.
“As these survey results show, the public really appreciate what Britain’s farmers and growers do day-in, day-out. 90% of the public feel farming is important to the UK economy while 81% agreed that British farms should grow as much food as they can to provide national food security.”
See who is supporting Back British Farming Day
“We know we have huge public support – we now just need our politicians to also back British farming like never before.”
NFU President Minette Batters
Key stats at a glance
- 87% support increasing self-sufficiency in UK food production. This compares to 80% when we first asked the public in 2022.
- Of 10 occupations, farmers ranked 2nd in favourability with 47% of respondents – up from 4th in 2022.
- 90% of the public feel farming is important to the UK economy.
- 81% agreed that British farms should grow as much food as they can to provide national food security.
2000 adults in England and Wales responded to a OnePoll online survey for the NFU between 30 May and 6 June 2023.
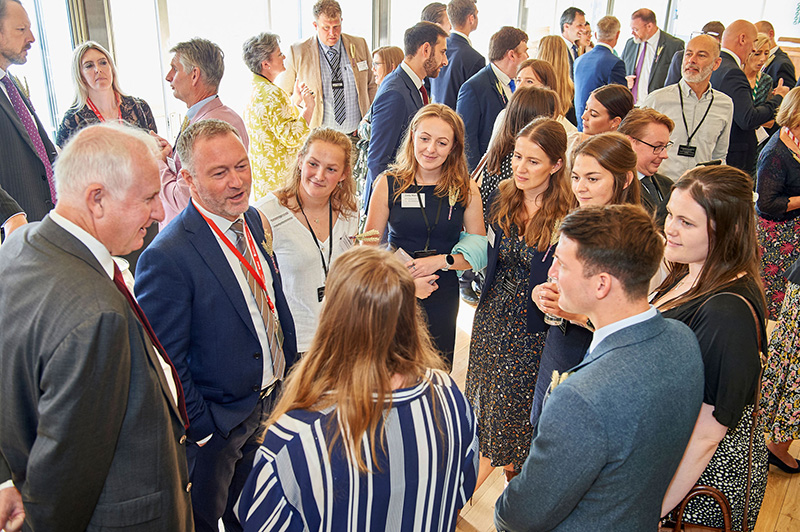
The NFU hosted a breakfast reception in the House of Commons kindly sponsored by Siobhan Baillie MP, during which MPs learnt about the important work that British farmers and growers do all year round. MPs also had the opportunity to publicly demonstrate their support for farming by wearing our iconic wool-and-wheatsheaf badge during Prime Minister's Questions, grabbing a photo, and sharing their support via Twitter using the hashtag #BackBritishFarmingDay.
Also in attendance was CEO of City Harvest, Sarah Calcutt – see how City Harvest is helping combat food waste.
MPs heard that, according to the Farmer Favourability survey, 87% of respondents support increasing self-sufficiency in UK food production.
Minette added: “This is a clear message that the public backs our calls for government to prioritise homegrown food production and legislate to ensure the UK’s self-sufficiency does not drop below its current level of 60%.
“Fundamentally, investing in domestic food production means we can increase our productivity, create more jobs and deliver much more for the economy and for the environment.
“We know we have huge public support – we now just need our politicians to also back British farming like never before.”
Other high profile people who got involved on the day included Jamie Oliver, Jeremy Clarkson, Kaleb Cooper, Adam Henson and JB Gill as #BackBritishFarmingDay trended at number 10 in the UK on X, formerly Twitter. On top of that, hundreds of members of the public posted on social media, joining farmers to share supportive messages that reached an audience of millions.
Farmers are ‘the bedrock of our communities’
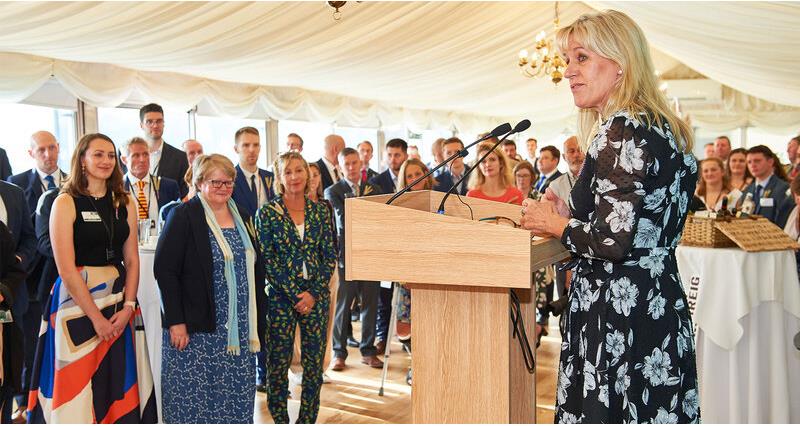
In her opening address, Defra Secretary of State Thérèse Coffey said farmers are “the bedrock of our communities, right around the countryside, but more importantly our farmers are the people who put the food on our plates”.
During her speech, the Defra Secretary made a series of positive commitments, including support for a ‘buy British button’ in online supermarket shopping, a new grant scheme for rooftop solar panel installation, confirmation that farmers enrolling in new environmental support schemes will be able to use them to meet public procurement standards and a new £4m fund to help upgrade existing small abattoirs. An accelerated payment for SFI 2023, which will be made during the first month of the agreement was also announced.
See: Defra promises ‘accelerated payment’ for SFI agreements
“One of the things I’ve been clear about since coming into Defra is this transition people are under,” said Ms Coffey. “I’m very conscious that as the guaranteed income from BPS starts to go away, we needed to make sure we had as many options as possible in order for farmers to be able to pick and mix, not be told by Whitehall what they had to do in order to get this money, but to have a range of options that would suit and fit every farm.
“One of the things that is absolutely vital is that the money gets paid out. So I’m pleased to say that we will be making a payment, within a month, of 25% of the payment rather than having the normal three months in arrears because I want farmers to have the cash and the confidence to get on and do the job and access those schemes and deliver.
“I want to assure everybody who has come here to celebrate and back British farming that absolutely, this government is on your side.”
117141,117142,117143,117145,117147,117148,117149,117150
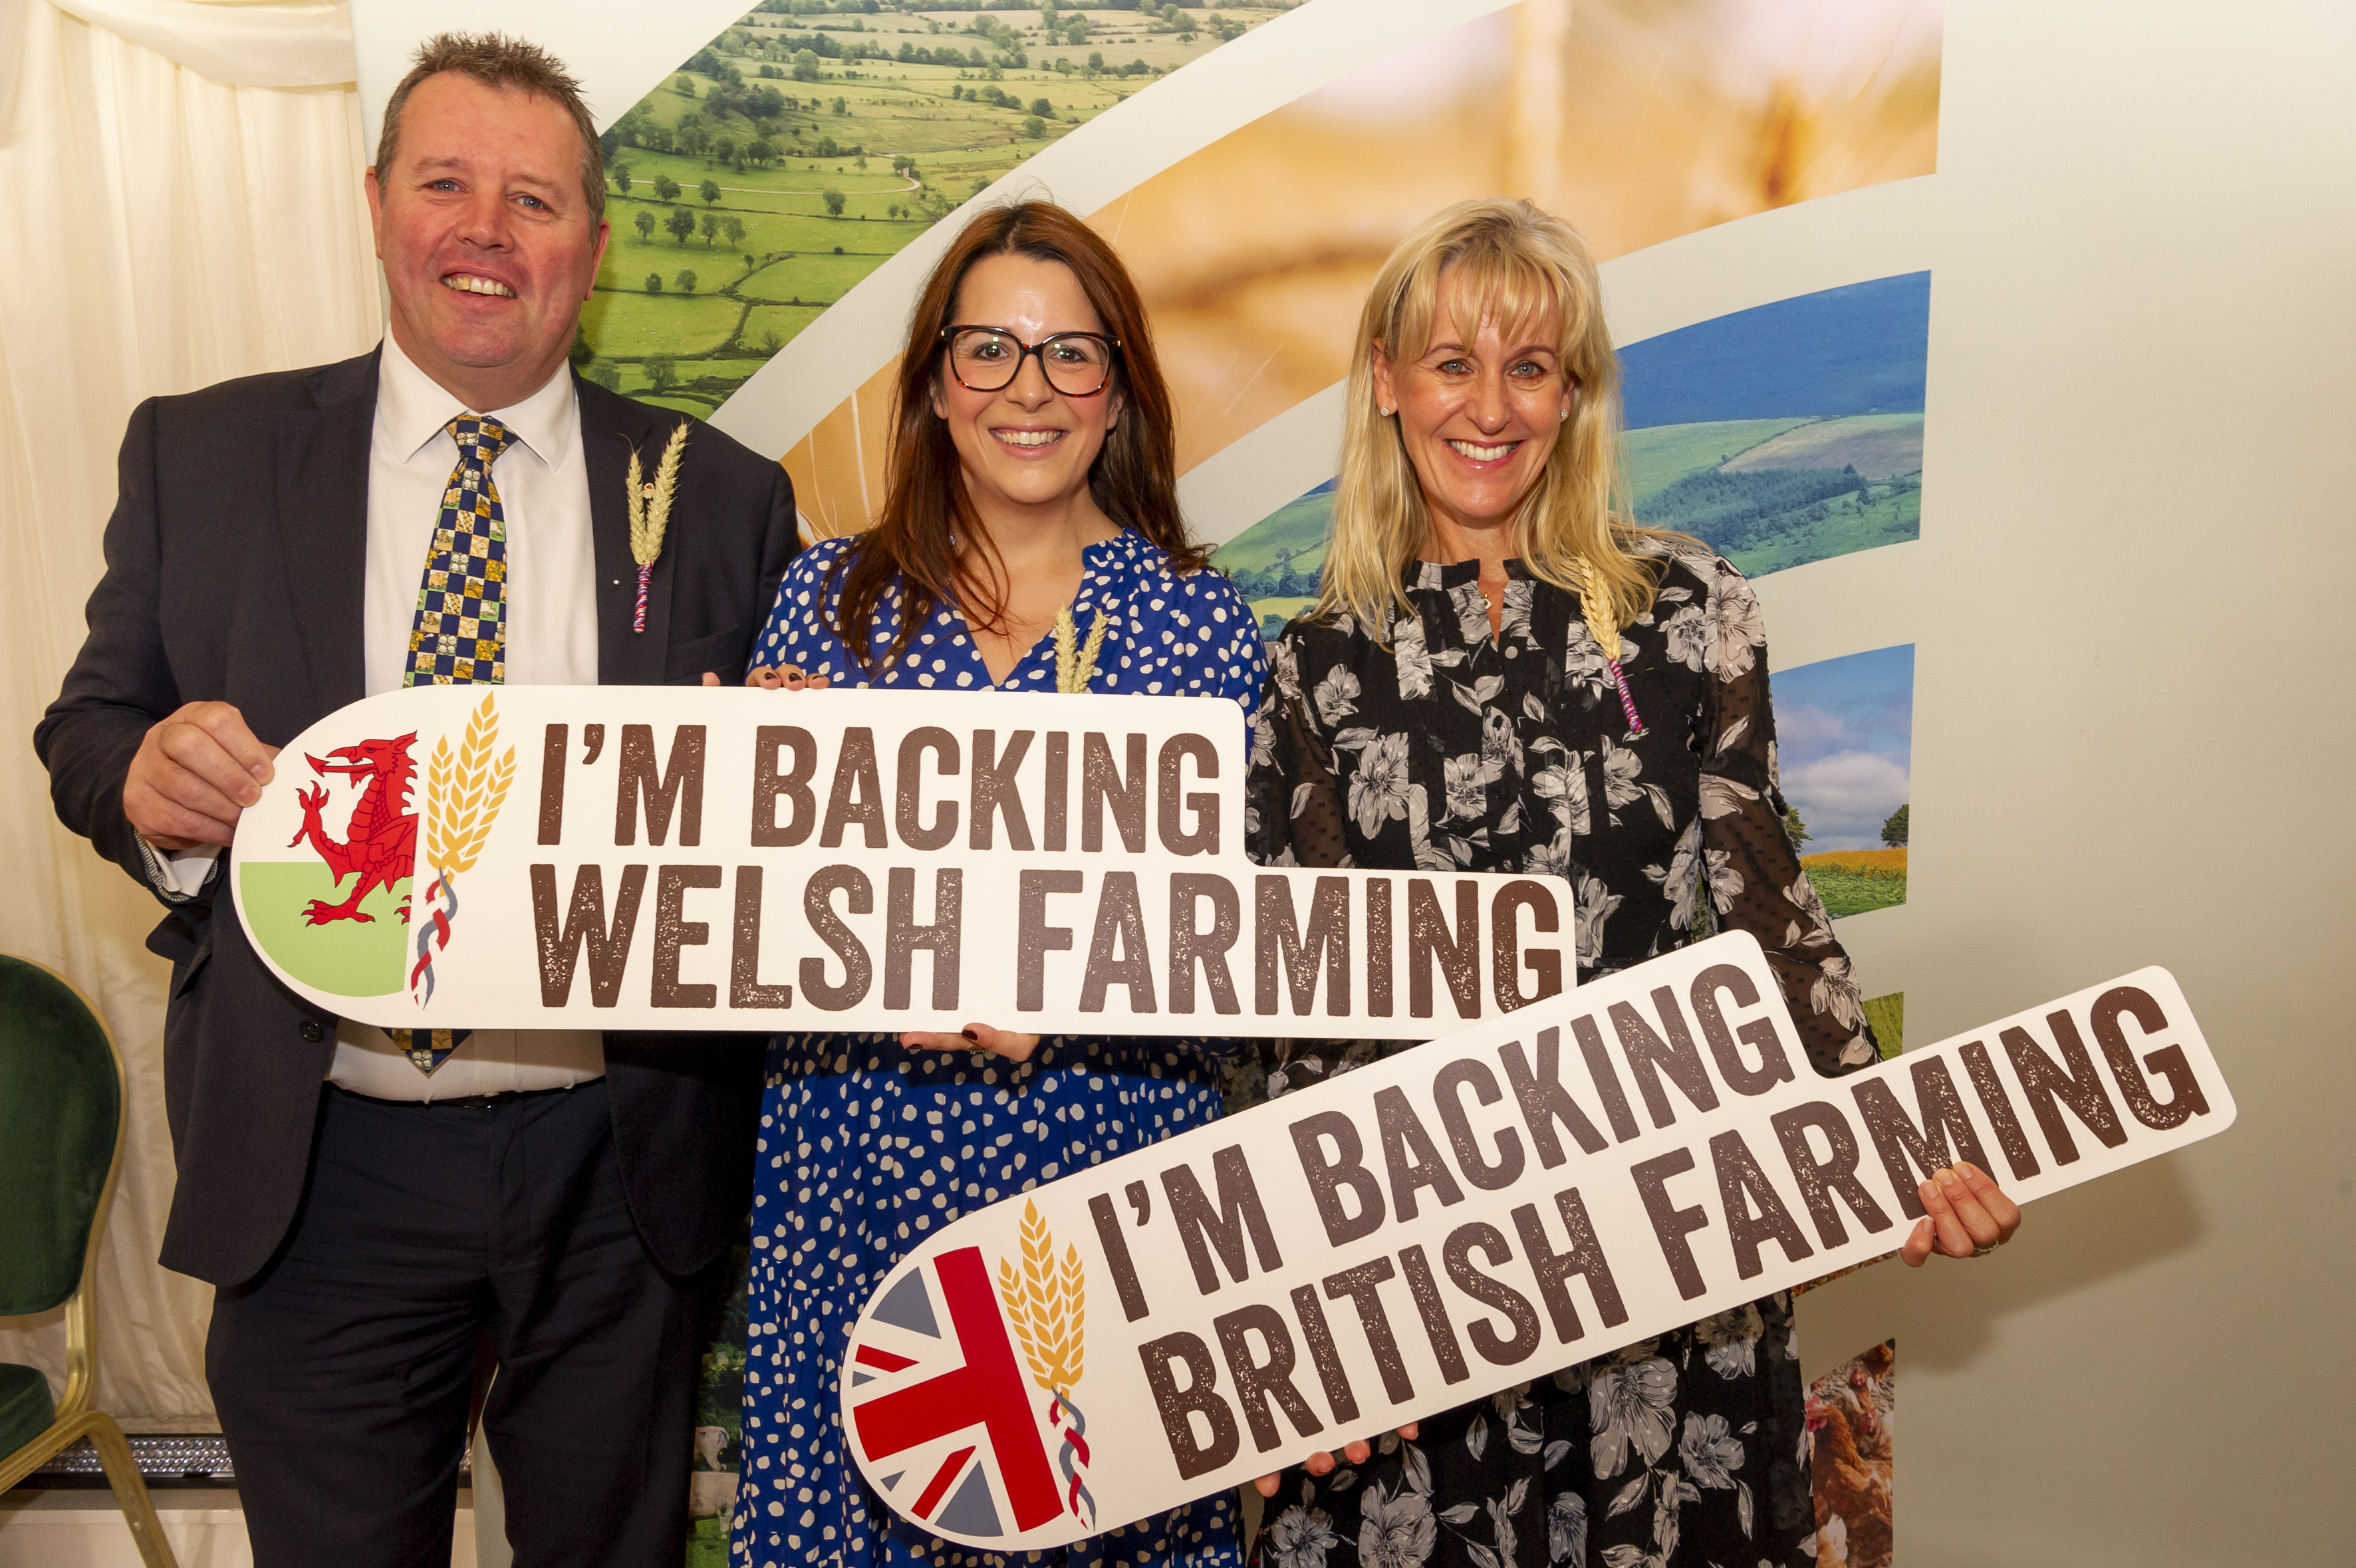
Mark Spencer MP with Fay Jones MP and Minette Batters
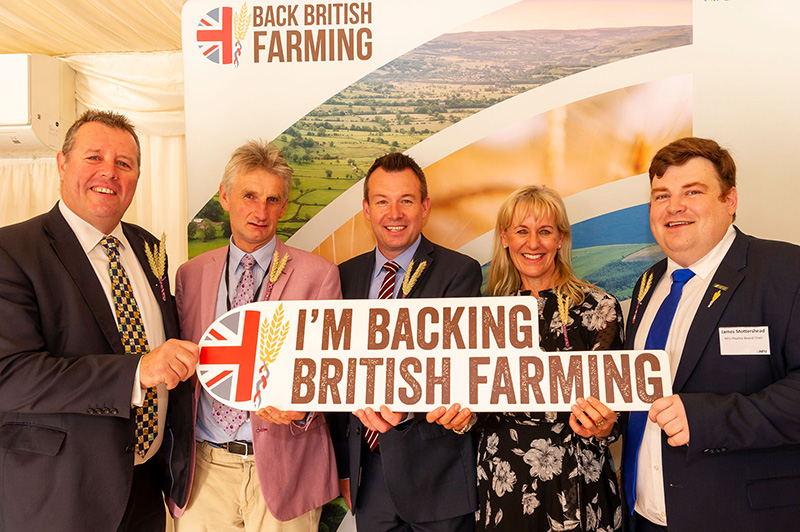
L-R: Mark Spencer MP, NFU Organics Forum vice chair Mark Wycherley, Stuart Anderson MP, Minette Batters, NFU Poultry board chair James Mottershead
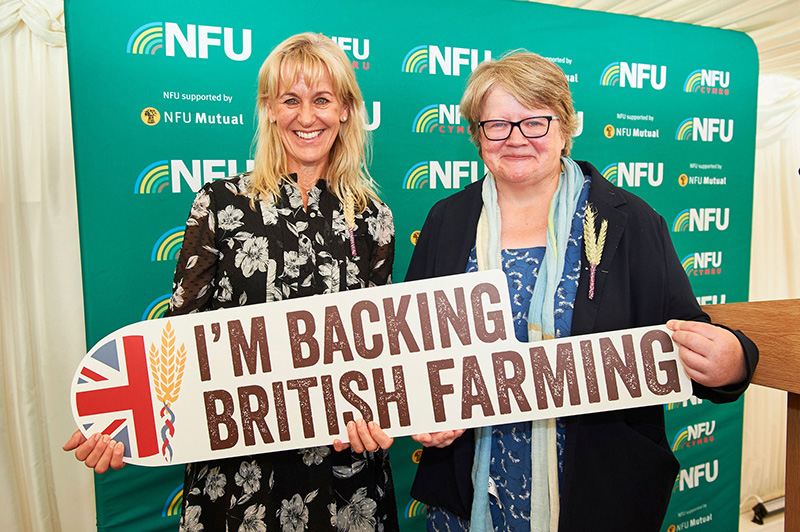
Minette Batters with Defra Secretary of State Thérèse Coffey MP
Minette Batters with Sarah Calcutt, CEO of City Harvest
Siobhan Baillie MP with NFU members Jenny and Ryan Camm (left), and Richard and Mary Chapman (right)
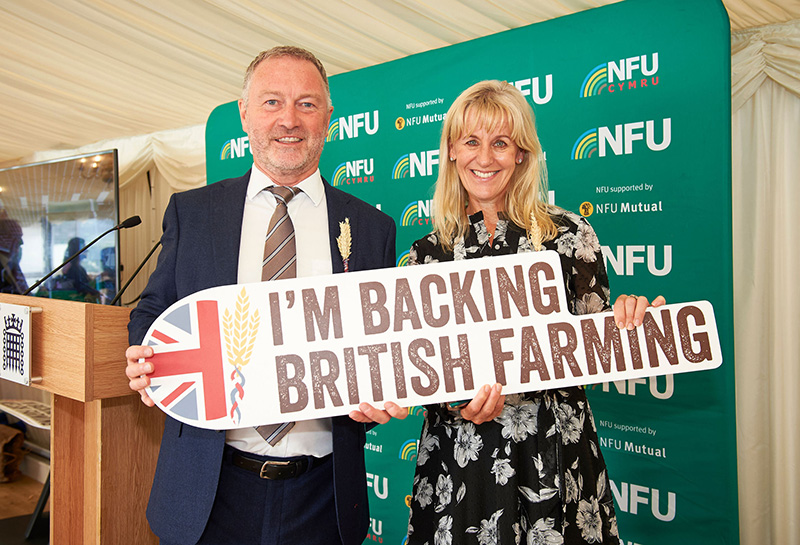
Minette Batters with Steve Reed MP, Labour Shadow Defra Secretary of State
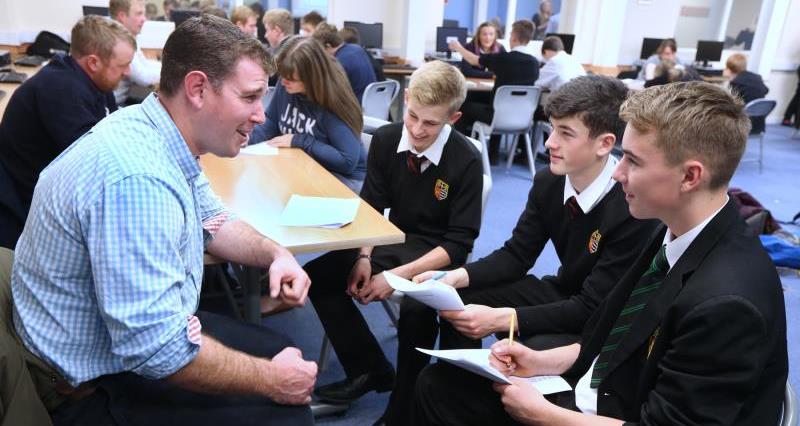
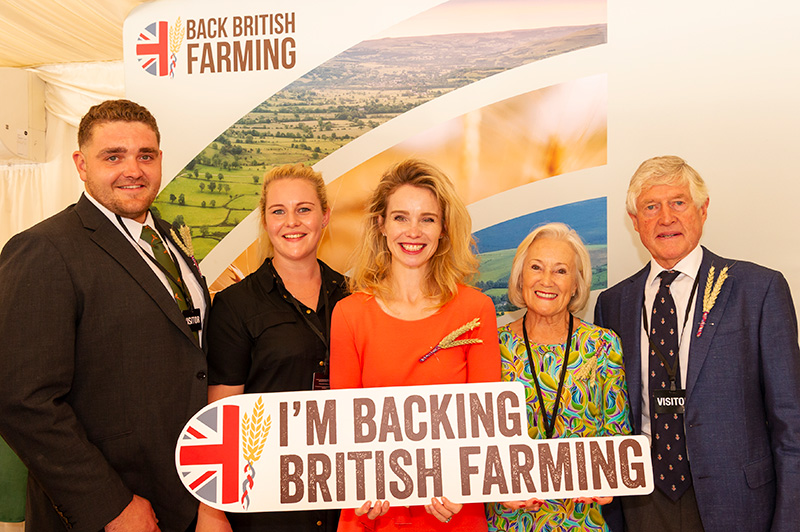
NFU Student & Young Farmer Ambassadors with Steve Reed MP and Daniel Zeichner MP
Coverage in numbers
- 6 mentions on national radio, with shoutouts from Chris Moyles and Zoe Ball.
- 14 mentions in trade paper and magazines, including Farmers Weekly and Farmers Guardian.
- 34 mentions in national papers, magazines and TV shows, including The Sun, The Telegraph, GB news, Times Radio and the Independent.
- 96 mentions in regional papers and magazines.
What is the wheatsheaf pin badge?
The wheatsheaf badge is representative of the celebratory spirit of Back British Farming Day. Members of Parliament will wear the badge in PMQs (Prime Minister's Questions) to demonstrate their support for British farmers.
It’s made of wheat sourced from farms in the spectacular countryside of Shropshire, and wool from Devon’s Blue Face Leicester sheep which has been spun and dyed blue and red specifically to celebrate British food and farming.
The badge is emblematic of all that British farmers and growers deliver for rural communities and the nation, producing climate-friendly food while also caring for our cherished landscapes, providing sustainable and natural fibres for clothing and insulation, producing renewable energy and much more.
Look out for our iconic wheatsheaf badge being worn today to show their support for our amazing British farmers 🌾#BackBritishFarmingDay pic.twitter.com/dkkKv7MlZ8
— National Farmers' Union (@NFUtweets) September 13, 2023